
Bitcoin is no longer responding to rising global liquidity the way it did in the last cycle. Even as money supply expands, a stronger dollar is tightening financial conditions faster than liquidity can lift prices.
Bitcoin traders love one chart more than almost any other: global M2 liquidity with a time lag.
More money expanding across the world eventually finds its way into risk assets, and Bitcoin rides the wave. For stretches of the past cycle, that framing looked clean enough to treat as a rule.
That framing runs into trouble right now. Broad money is still climbing, yet Bitcoin is trading like an asset pinned under a macro ceiling.
Why this matters: This marks a shift in how macro signals are translating into crypto markets. Liquidity expansion alone is no longer enough to drive price in the short term, as faster-moving forces like dollar strength and rate expectations are taking priority.
For investors, that changes how Bitcoin should be interpreted: less as a simple liquidity proxy, and more as a market reacting to competing macro speeds.
FRED data show US M2 at $22.667 trillion in February, up from $22.469 trillion in January and $22.387 trillion in December.
Those numbers describe a clearly expansionary backdrop, while a Bitcoin price near $68,000 registers something else entirely.
Traders are collapsing two distinct macro transmission speeds into a single chart and expecting a tidy result.
Two clocks, one price
M2 is a monthly stock measure. It accumulates gradually, over quarters, and its influence on risk assets is similarly slow.
When liquidity conditions expand, it tends to ease financial conditions broadly, lowering hurdle rates, loosening credit availability, and nudging capital toward riskier positions.
Yet that process takes months to manifest in prices fully.
Dollar strength operates on a different clock entirely. When the dollar index climbs, financial conditions tighten almost immediately.
The Federal Reserve’s own minutes are explicit: a stronger dollar, together with higher yields and lower equity prices, tightens financial conditions as a package.
BIS research supports the same transmission, and IMF analysis finds that a 10% dollar appreciation linked to global financial market forces reduces output in emerging markets by 1.9% within a year, worsening credit availability and capital inflows in the process.
March demonstrated exactly that hierarchy. The dollar index logged a 2.35% monthly gain and a 1.7% quarterly gain in its best quarter since late 2024, as safe-haven demand, the war in Iran, oil shock, and a sharp repricing of Fed rate-cut expectations all pushed investors back into the greenback.
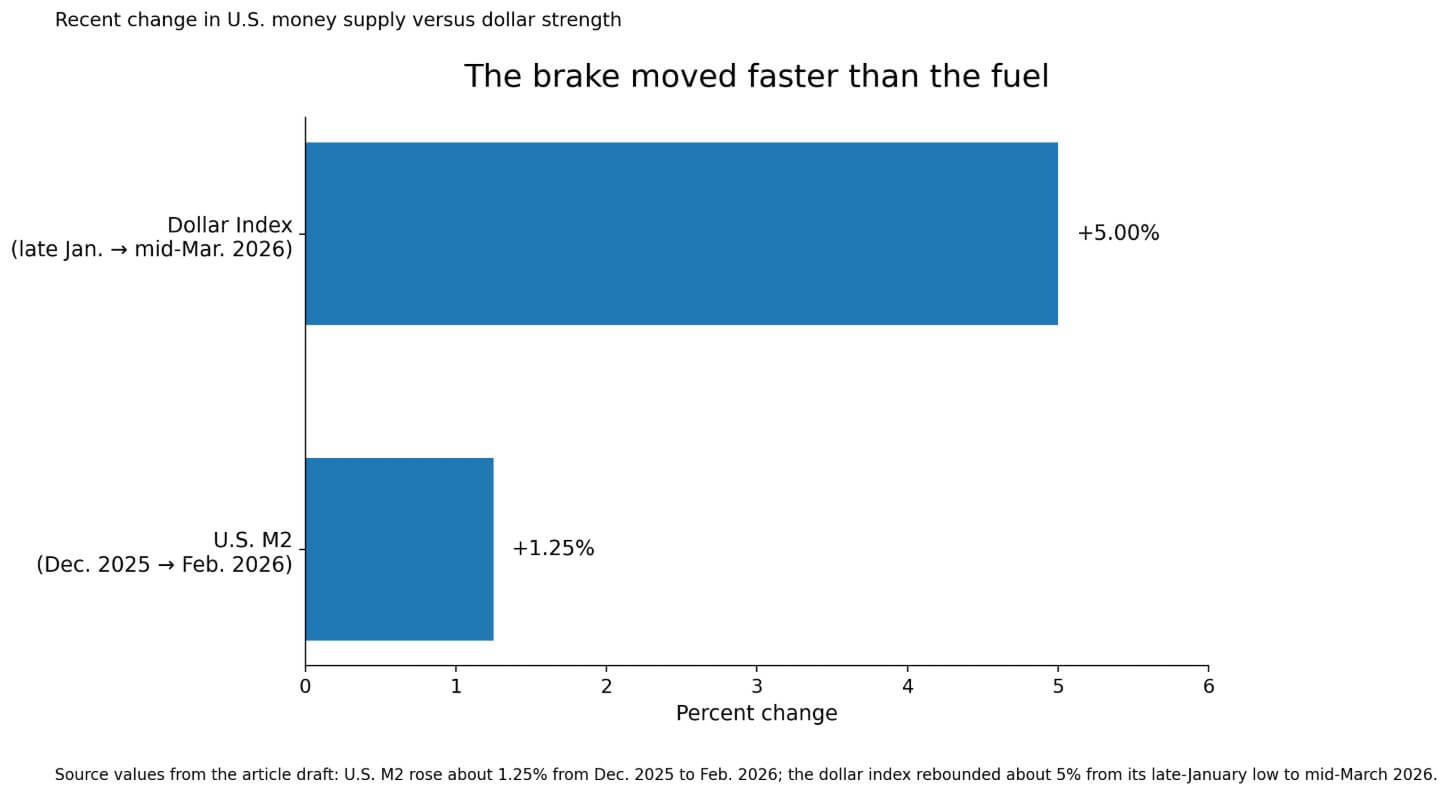
From its late-January four-year low, the dollar index had already rebounded roughly 5% by mid-March.
Over that same stretch, US M2 climbed about 1.25%. The brake moved roughly four times faster than the fuel.
The key shift is not that liquidity has stopped expanding, but that it is being outrun by faster tightening forces. Bitcoin is reacting to the speed of change, not just the direction.
Why Bitcoin absorbs dollar moves first
Bitcoin sits in an unusual position among risk assets. It trades continuously across global venues, prices against dollars and dollar proxies, and attracts a global investor base, making dollar-denominated return calculations.
That makes it one of the fastest markets to absorb dollar tightening before M2’s slow accumulation can work its way through credit channels, capital flows, and broader risk appetite.
The oil shock amplifies this, as commodity surveys in March raised the 2026 Brent forecast to $82.85 per barrel from $63.85 the prior month, the steepest upward revision in the survey’s history, and warned Brent could reach $190 if the Strait of Hormuz stays closed.
An oil shock of that scale raises inflation expectations, forcing markets to price out rate cuts. The market had moved from pricing at least 50 basis points of Fed easing by December to barely one quarter point of cuts fully priced.
That repricing arrives in dollar and rate markets within days, and the M2 data for the corresponding period will not even be published for another month.
A subtler point reinforces this. Most popular “global M2” charts aggregate foreign money stocks and convert them into dollars, which means exchange-rate moves affect the composite by construction.
| Variable | Transmission speed | Effect on Bitcoin |
|---|---|---|
| M2 / broad liquidity | Slow, accumulates over months | Acts as a background tailwind for risk appetite |
| Dollar strength | Fast, reprices in days or weeks | Tightens financial conditions quickly and pressures BTC |
| Oil / Fed repricing | Very fast | Reinforces dollar strength and delays liquidity expression |
When the dollar strengthens, it compresses the dollar value of foreign-currency aggregates even as local-currency measures hold steady.
As one data provider notes, exchange rate fluctuations can have a similar effect on overall liquidity and should be considered alongside raw money-supply figures.
The dollar then functions on two levels: as a competing variable running alongside the M2 chart, and as a variable that already enters the composite calculation directly.
Dollar strength can simultaneously slow the chart’s climb and compromise the importance of the chart’s direction for Bitcoin.
What the M2 thesis actually says
All of this narrows the M2 thesis. Broad money is a useful proxy for background liquidity conditions over multi-month windows, particularly when the dollar is stable or weakening.
In those environments, the gradual accumulation of money supply can act as a slow tailwind for risk assets, with Bitcoin among the more sensitive beneficiaries.
The relationship looks cleaner in calmer macro regimes precisely because the fast variable, the dollar, is pulling in the same direction, or at least staying out of the way.
The current episode confirms the hierarchy: when dollar strength and risk aversion dominate the short-run picture, they can keep Bitcoin pinned well below where a climbing M2 line alone would place it.
The bull case is that the dollar’s March surge proves temporary. If geopolitical stress eases, oil retreats from its highs, and markets reprice some Fed easing back in, the dollar’s tightening impulse will weaken quickly.
Some strategists see part of the March dollar move as a risk premium that could fade if conditions stabilize. In that environment, the background M2 tailwind reasserts itself over the coming months, Bitcoin’s divergence from the liquidity chart closes, and the traders who called the M2 thesis broken look premature.
| Scenario | What changes | What it means for Bitcoin |
|---|---|---|
| Bull case: dollar surge fades | Geopolitical stress eases, oil retreats, some Fed easing gets repriced back in | M2 tailwind reasserts itself and BTC can close the gap with the liquidity chart |
| Bear case: dollar keeps upper hand | Oil, risk aversion, and cross-asset volatility stay elevated | BTC can keep diverging from the M2 script longer than liquidity watchers expect |
The bear case is the dollar extending its advantage. HSBC strategists said the dollar holds the upper hand as long as oil prices, risk aversion, and cross-asset volatility stay elevated.
In that scenario, Bitcoin can continue diverging from the M2 script longer than most liquidity watchers expect. Every month of elevated oil and compressed rate-cut expectations delays the moment when background money growth can translate into market performance.
The next test is whether the dollar’s momentum breaks before liquidity can catch up. If the dollar stabilizes or reverses, Bitcoin has room to realign with the underlying expansion in money supply. If not, the divergence can persist longer than liquidity models imply, forcing traders to recalibrate what actually drives price in the current cycle.